How to Draw a Standard Curve and Calculate Sample Concentration
2023-10-23
You can download our sample Excel calculation template, replace the placeholder data with your own, and obtain the results directly.
Click the link to get the excel:Download here
If you prefer to calculate the results manually, please follow the steps below using a curve-fitting software:
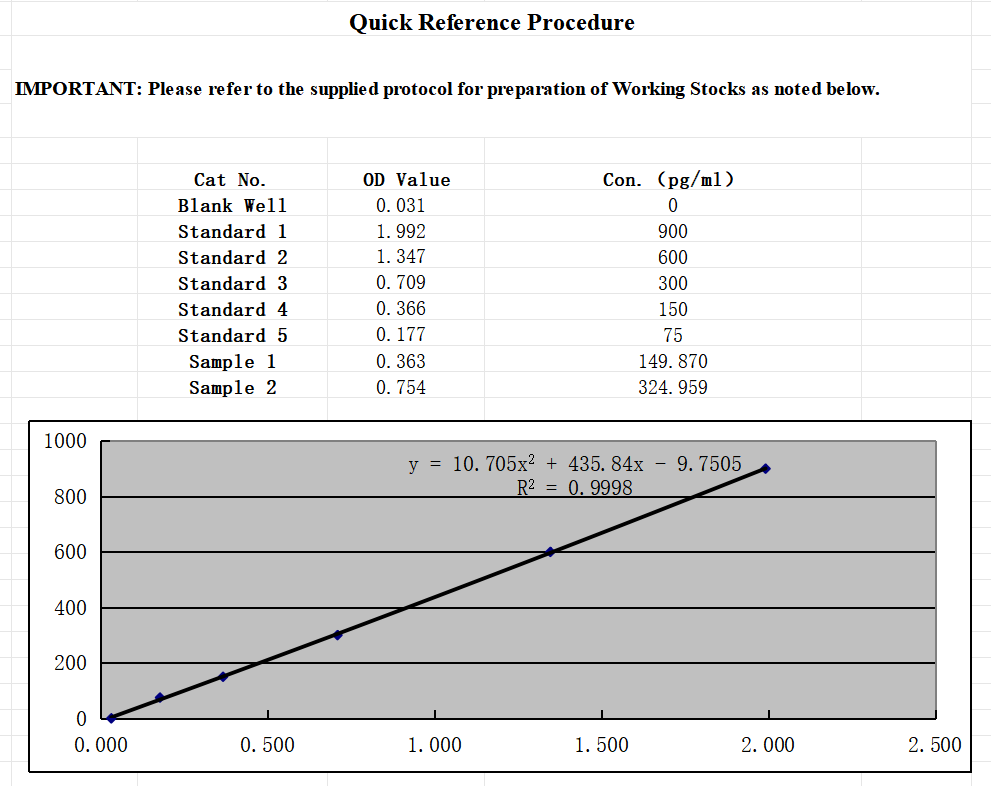
Using a Quadratic Polynomial Fit
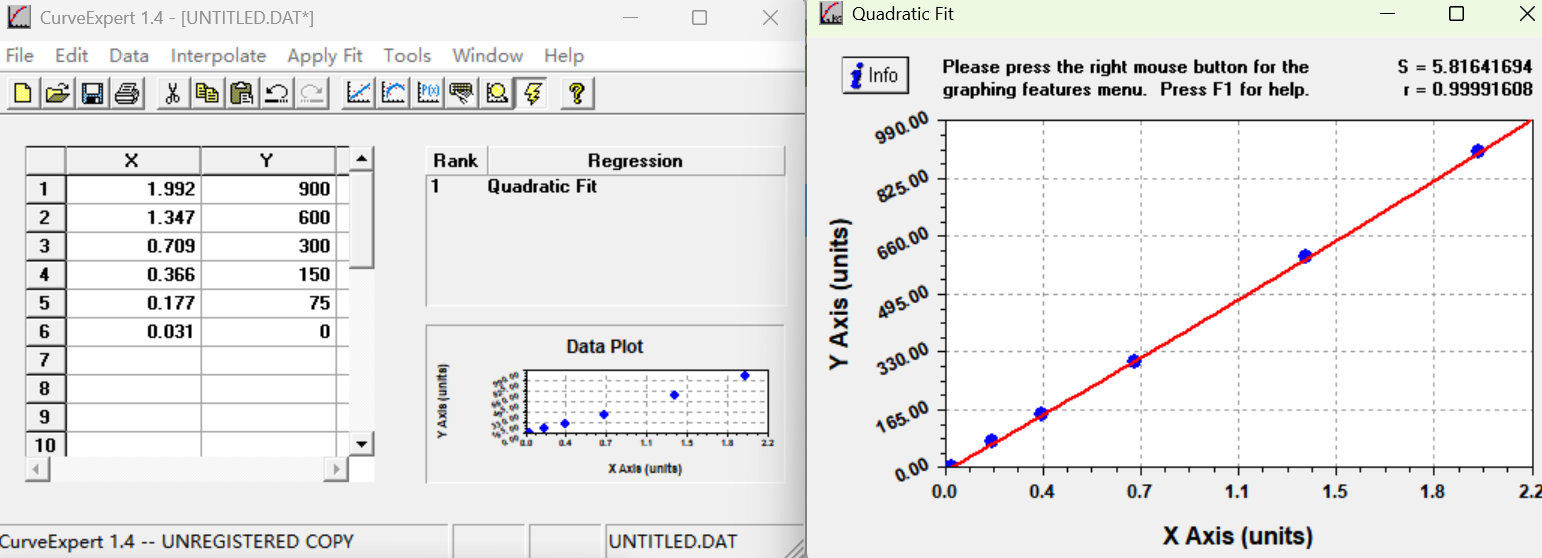
Researchers typically use specialized tools for curve fitting, such as CurveExpert 1.4. Below is an example of how to draw an ELISA standard curve using CurveExpert:

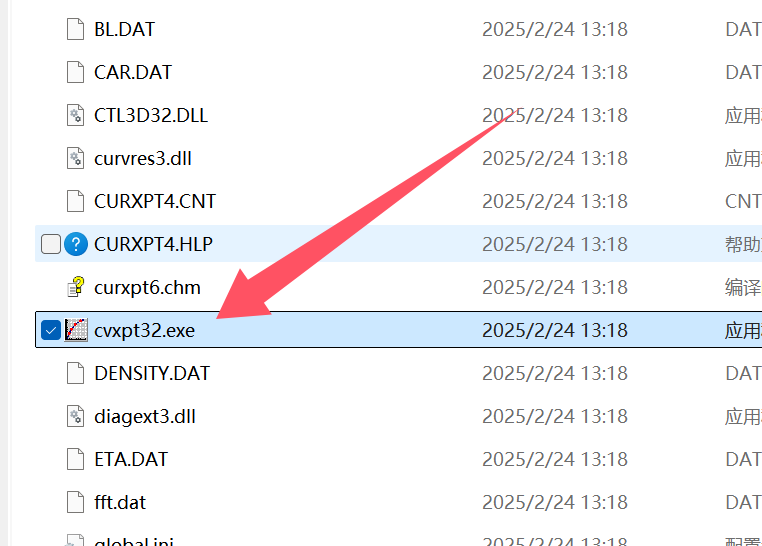
2. Assign your data: Input the OD values of your standards on the X-axis, and their corresponding concentration values on the Y-axis.
.png)
3.Starting from "1", click the curve names in the upper right corner one by one, and select the curve with the best fitting degree (the closer the "r" value is to 1, the better the fitting degree).

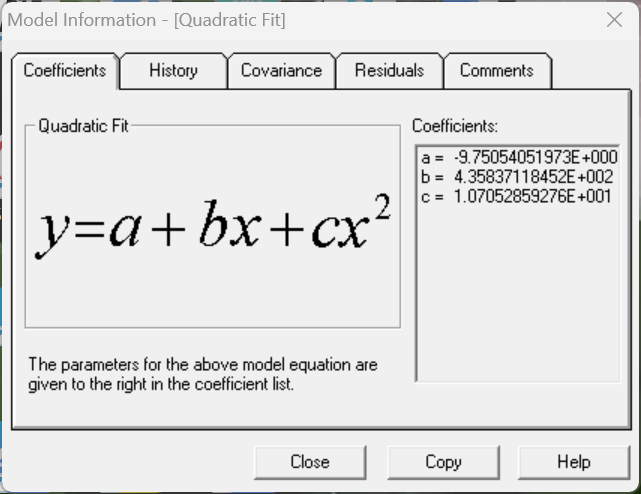
4 Right-click on the curve graph, and click [information] to obtain the formula and parameters.
5.Right-click on the curve graph, select Analyze, enter the OD value, and click Calculate to calculate the content
.png)


 +86 0571 56623320
 +86 18668110335

